The promoted product alone
−$0.17
Per $1 of discount, before any credit for the rest of the basket.
Across 79,340 evaluated promotions, gross margin was an estimated $0.17 lower per discount dollar than the baseline. Costs and supplier funding are assumed. The results identify promotions to test before changing the calendar.
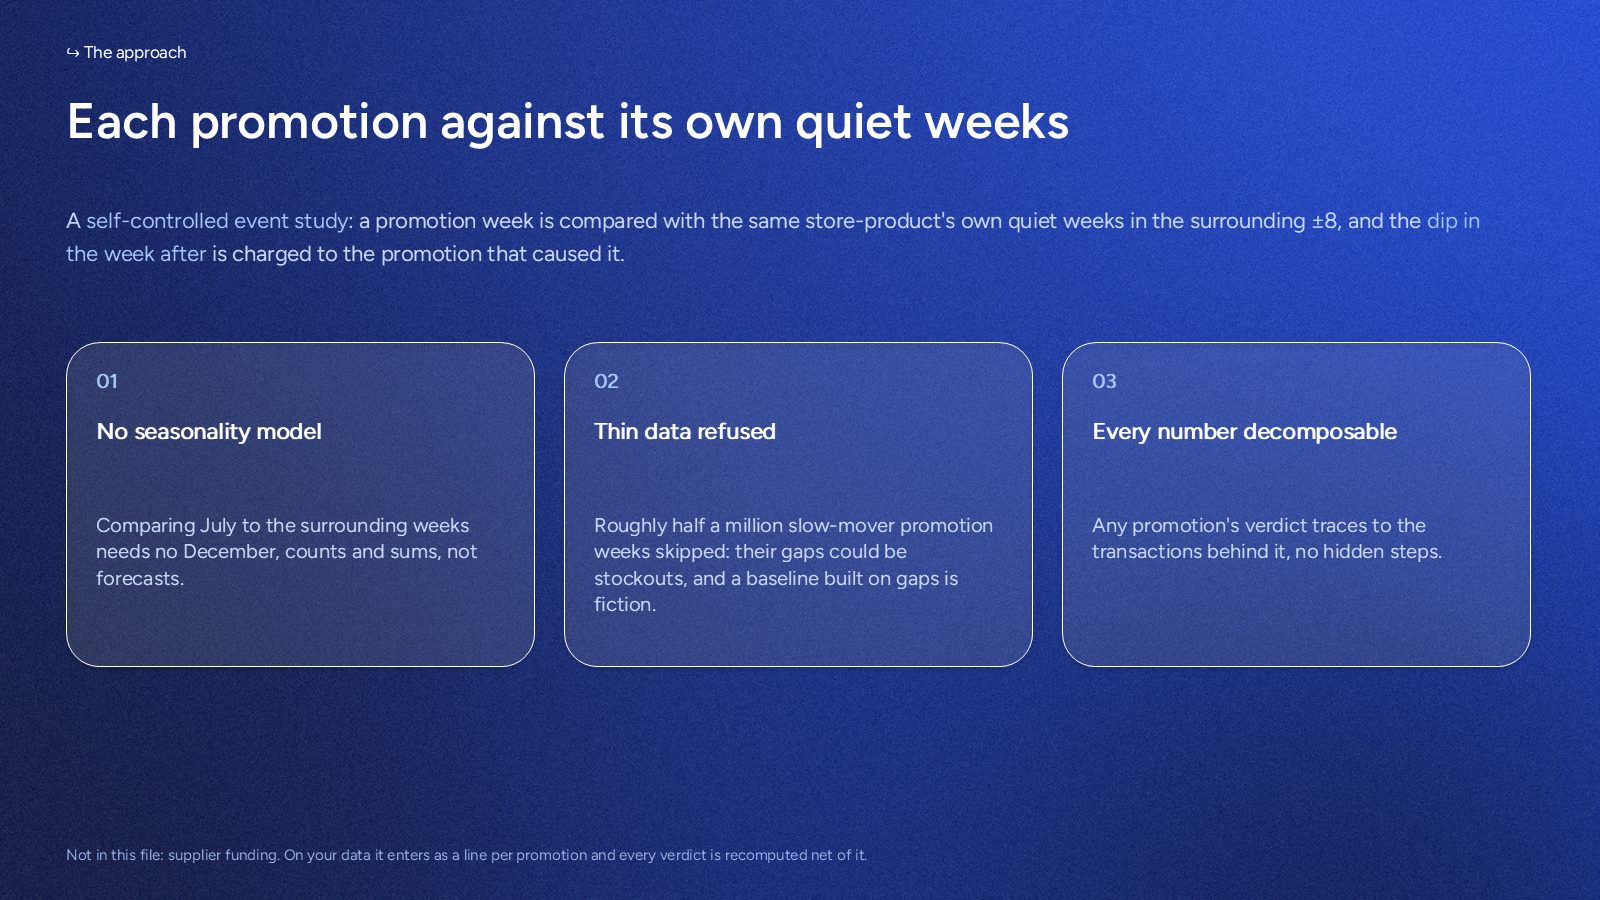
I compared each promotion with nearby weeks for the same product and store, then included a following-week adjustment where available. Units and revenue are observed. Normal prices and baseline sales are estimated, while costs and funding are assumed. The sample covers 28% of the file's discount dollars.
Estimated margin during the promotion is compared with baseline margin for the same product and store. The following week can improve or reduce the result.

The calculation separates observed sales, estimated baselines and assumed costs.
Normal price is reconstructed using the upper-half mean of up to 13 nearby price observations per product and store. A weekly paid price at least 10% below that reference identifies a promotion. Consecutive promotion weeks form one event. Event depth bands use average paid price relative to the baseline reference.
checked on a retailer with true prices: bias −0.11% · 85% of real promotions found · 2.7% false alarms
Baseline volume is the average over at least four weeks without a detected discount, within eight weeks before and after the event. Missing sales weeks count as zero. The product-store series must have sales in at least 62 of 104 weeks. This does not fully control for stockouts, holidays or non-price promotions.
extra units = promotion-week units − baseline mean
Subtract baseline gross margin from promotion gross margin, using each period's own assumed unit cost. Add the following-week adjustment, positive or negative, where available. Assumed promotion costs include supplier funding. Placement fees are excluded.
margin change per $1 = (promotion margin − baseline margin + following-week adjustment) ÷ discount
The source contains 3.3 million baskets across four categories. Companion items are shared so no line of a basket is credited to more than one promotion, in the promoted weeks and in the week after. The optimistic scenario attributes the full estimated increase in companion margin to the promotion and treats extra baskets as new trips.
optimistic attribution: not established; the sharing rule changes the result

At assumed costs, pooled margin change per discount dollar was +$0.26 below 15%, −$0.07 at 15% to below 30%, and −$0.31 at 30% or more. Individual results vary: 45% of shallow promotions and 84% of deep promotions had a negative estimated margin effect. This does not establish an optimal discount cutoff.


This check avoids choosing a cost amount, but still requires constant unit cost and relies on the estimated baseline.
Including the following-week adjustment, revenue below baseline with at least as many units implies lower gross margin at an unchanged nonnegative unit cost.
11.1% of the 79,340 promotions fail that test. On the deepest discounts, one in six.
A lower promotion unit cost, including extra supplier funding, can offset the revenue decline. Check actual funding before classifying these events as losses.
Promotions may affect purchases of other products. The basket analysis explores that possibility within four categories. It cannot identify which trips were caused by the promotion.
Per $1 of discount, before any credit for the rest of the basket.
Estimated companion-item margin under optimistic attribution, at assumed costs. This is a scenario, not a statistical upper bound.
Combined estimated margin change per discount dollar within four categories. Neither the basket allocation nor the store-level comparison supports an estimate, so whole-store profitability stays open.
The limits.
523,909 promotion events were excluded for sparse sales history and 67 for other baseline/data checks. The 79,340 evaluated events cover 28% of discount dollars, not the full calendar.
The following-week adjustment can be positive or negative. It is not proof of stockpiling. Longer effects may be missed, although a two-week sensitivity run gave a similar pooled result.
Unit costs and supplier funding are assumed. Replace them with actual inputs and add placement fees before making a client recommendation. Bootstrap intervals describe sampling variation, not uncertainty in these assumptions or the baseline.
Start with the question. If your export cannot support the study you have in mind, you will know on the first call, and in writing within two days.